
Table of Contents
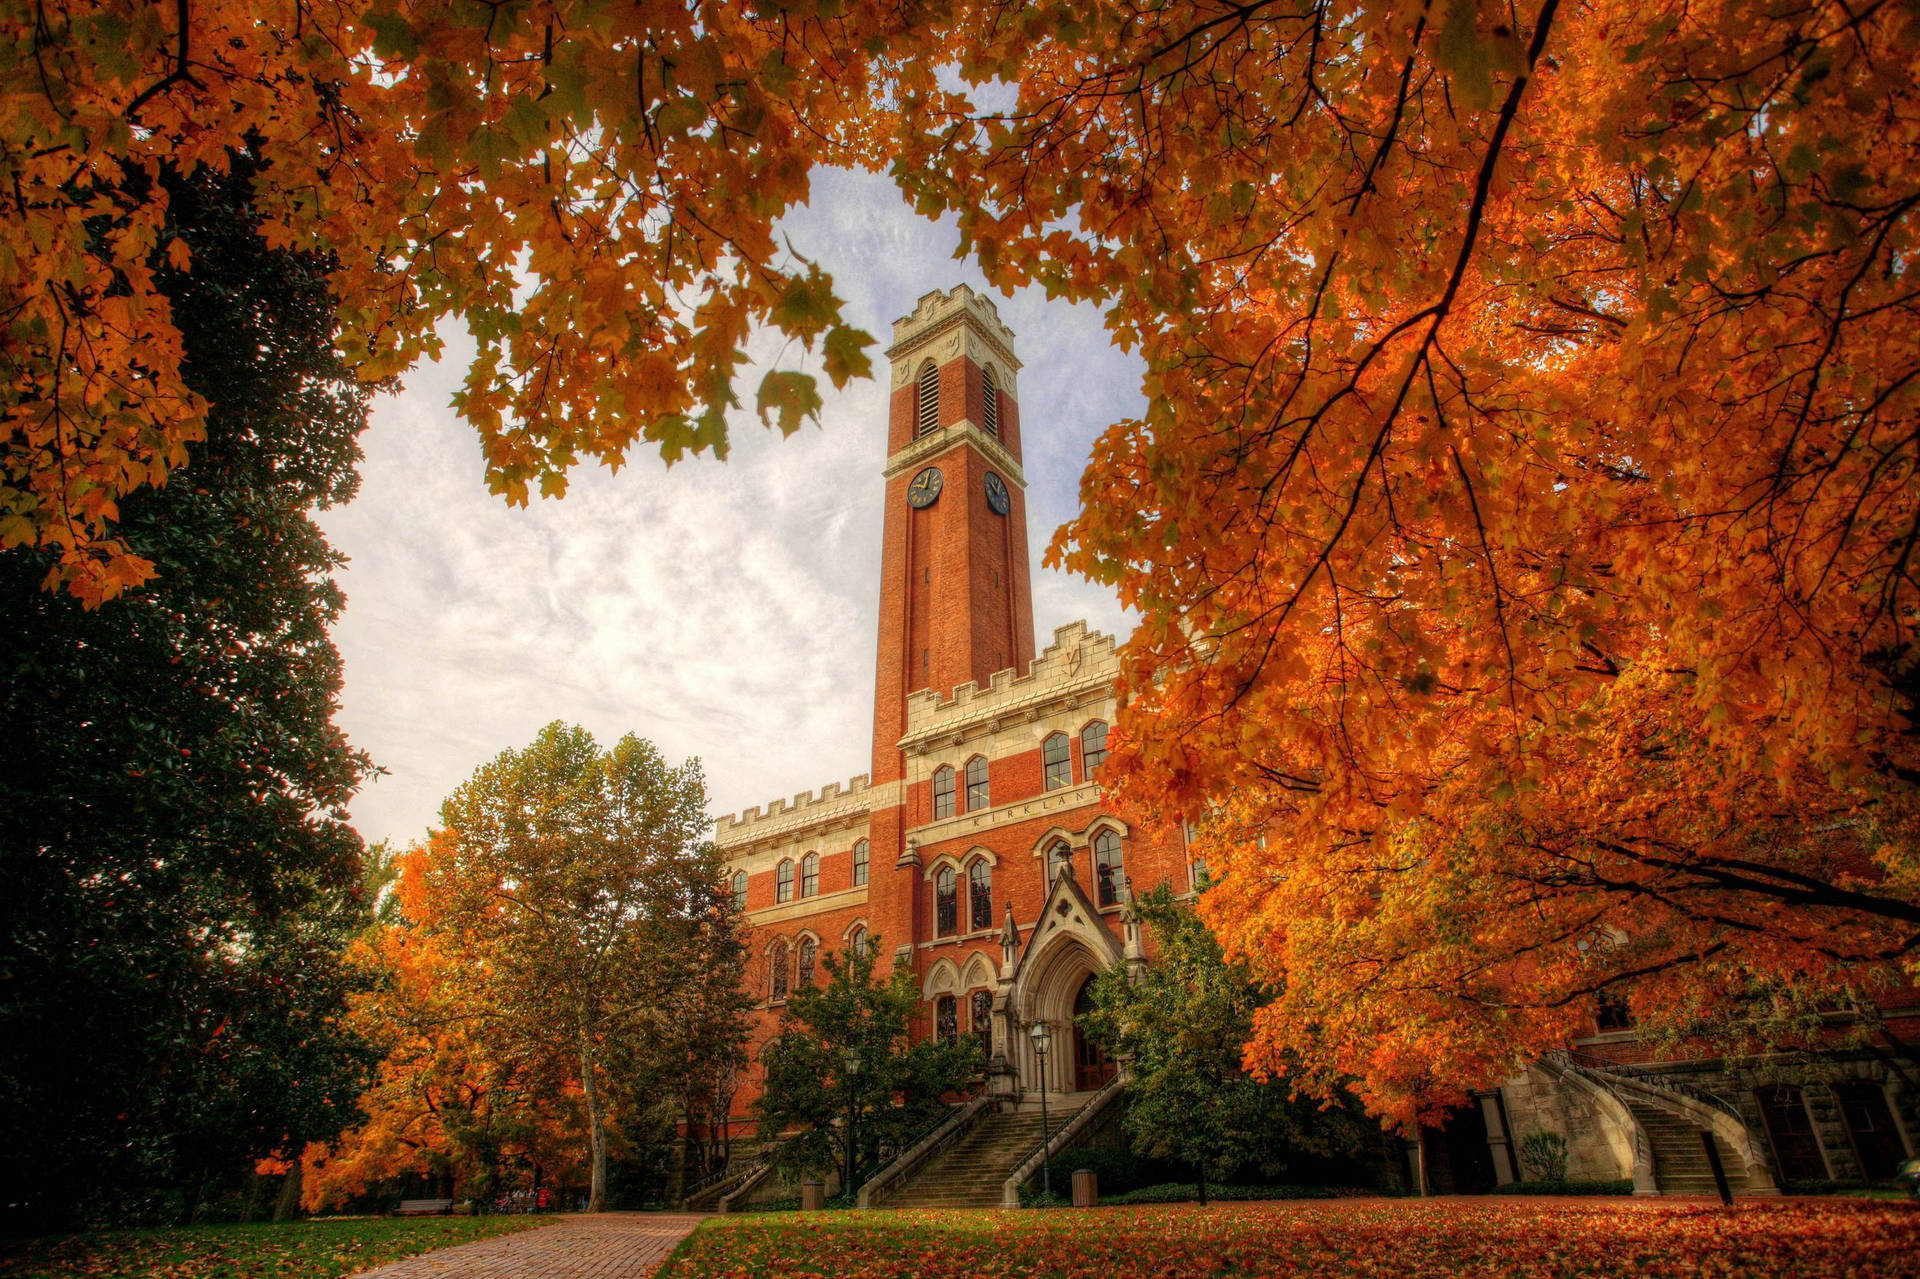
Vanderbilt University has solidified its position as one of the most highly sought-after institutions in the United States. Often referred to as a "Southern Ivy," Vanderbilt's appeal has surged in recent years thanks to its prime location in Nashville, robust financial aid programs, and a vibrant campus culture that balances elite academics with Division I athletics. As applications have skyrocketed, Vanderbilt’s acceptance rate has plummeted, transforming the university from a competitive target for high-achieving students into an ultra-selective reach school.
Class of 2030 Admissions Statistics (Latest)
For the Class of 2030, Vanderbilt University experienced its most competitive admissions cycle in history.
During the 2025-2026 application cycle, Vanderbilt received a staggering 56,447 total applications. Out of this massive pool, the university admitted just 2,302 students, resulting in a historic low overall acceptance rate of approximately 4.1% [1].
When we break these numbers down by decision plan, the stark reality of Vanderbilt's selectivity becomes even clearer. The university received 7,727 applications across its two binding Early Decision (ED) rounds, admitting 920 students for an ED acceptance rate of 11.9%. Meanwhile, the Regular Decision (RD) pool saw 48,720 applicants vying for the remaining spots, of which only 1,382 were admitted, pushing the RD acceptance rate down to an incredibly tight 2.8% [2].
Insight: Our analysis shows that Vanderbilt aims to fill about half of its incoming class of roughly 1,620 freshmen through Early Decision. For students who were not offered initial admission, the waitlist remains a viable pathway; university officials anticipate that approximately 10% of the enrolling freshman class will ultimately be admitted from the waitlist [3].
Historical Acceptance Rate Trends
The trajectory of Vanderbilt's admissions competitiveness over the past decade is striking. Just a few years ago, for the Class of 2024, the overall acceptance rate sat at 11.6%. Since then, it has steadily declined year over year: 7.1% for the Class of 2025, 6.1% for 2026, 5.6% for 2027, 5.1% for 2028, and 4.7% for the Class of 2029, finally arriving at the ~4.1% mark for the Class of 2030 [4].
Insight: This continuous drop is driven by two main factors: a surge in application volume and a dramatically climbing yield rate (exceeding 61% recently). Because more admitted students are choosing to enroll when accepted, the admissions office must admit fewer students overall to avoid over-enrolling the freshman class.
Conclusion
In navigating Vanderbilt's admissions landscape, understanding the sheer volume of applicants and the highly selective nature of the process is crucial. As Vanderbilt University continues to grow in national prominence, its single-digit acceptance rates firmly place it among the most competitive universities in the country. We will continue to update these statistics as official census data is released later in the fall.
References
- The Vanderbilt Hustler: Record-low 2.8% of applicants admitted to Class of 2030 regular decision
- The Vanderbilt Hustler: Early decision acceptance rate down to 11.9% for Class of 2030
- The Vanderbilt Hustler: A steady decline in regular decision admission rates
- The Vanderbilt Hustler: Record-low 4.7% of applicants admitted to Class of 2029
Related Articles

Northwestern University Admissions Statistics: Class of 2030 (Latest)
A detailed breakdown of Northwestern University's latest admissions statistics, acceptance rate trends, and Early Decision data for the Class of 2030.
University of Washington Admissions Statistics: Class of 2030 (Latest)
A deep dive into the University of Washington's admissions statistics, including acceptance rate trends, residency breakdowns, and predictions for the Class of 2030.
University of Utah Admissions Statistics: Class of 2030 (Latest)
A comprehensive look at the University of Utah's admissions statistics, focusing on acceptance rates, application trends, and predictions for the Class of 2030.
University of Missouri Admissions Statistics: Class of 2030 (Latest)
A detailed look at the University of Missouri's admissions statistics, including predicted acceptance rates for the Class of 2030 and historical trends.
Indiana University Bloomington Admissions Statistics: Class of 2030 (Latest)
A detailed look at Indiana University Bloomington's admissions statistics, including the predicted Class of 2030 acceptance rate and historical trends.

Colorado School of Mines Admissions Statistics: Class of 2030 (Latest)
Discover the latest Colorado School of Mines admissions statistics, predicted acceptance rates for the Class of 2030, and historical waitlist and yield trends.
